High-Resolution Maps Detail Global Cropland Emissions and Mitigation Strategies


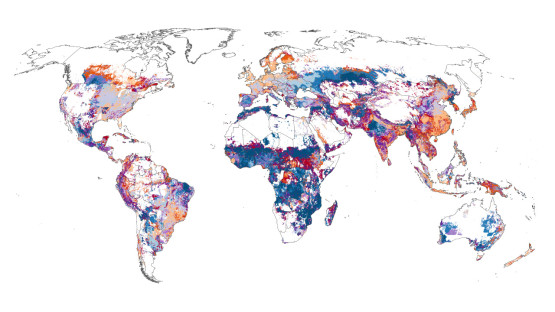
Researchers from Cornell University and the Land & Carbon Lab have developed high-resolution maps detailing global cropland greenhouse gas emissions by region, crop, and emission source. The study identifies rice, maize, wheat, and oil palm as the major crops responsible for 67% of emissions from croplands, which contribute nearly 5% of global net greenhouse gas emissions. Key emission sources include draining peatlands, flooded rice fields, and the use of synthetic fertilizers. Six countries—China, Indonesia, India, the United States, Thailand, and Brazil—account for 61% of cropland emissions. These detailed maps provide valuable insights for targeted mitigation strategies to reduce agricultural emissions worldwide.
Actors
Cornell University
Land & Carbon Lab
China
Indonesia
India
United States
Thailand
Brazil
Locations
China
Indonesia
India
United States
Thailand
Brazil